Roadview Explorer 5 Manual
Web-Enabled Data Viewing Software
Table of Contents
- Help Videos
- Launching the Application
- Searching for a Route
- Navigating Through a Route
- Adjusting the Current Route
- Image Zoom Mode
- Image Adjustments
- Saving Photolog Images
- Route Information Panel
- Working with Pavement Images
- Using the Map to Sort and Filter Assets
- Using the Map to Add Custom Esri Feature Layers
- Generating Printable Reports
- Linking Directly to a Frame
- Emailing a Route Position
- Generating IRI Reports
- Setting User Preferences
- Release Notes
Help Videos


Launching the Application
To open Roadview Explorer, launch a compatible web browser and enter the following address: https://roadview.udot.utah.gov/utah
Compatible browsers:
Searching for a Route
Clicking the Search a Route button will open the Route Search panel, which may include the following options for searching:
- Route Number
- Sign
- Year
- UDOT Mileage
- Route
- Direction
- Type
- Interchange
- Ramp Number
- Year
- UDOT Mileage
- Route Number
- Section
- Year
- UDOT Mileage
Note that the available items you see may vary depending upon your setup.
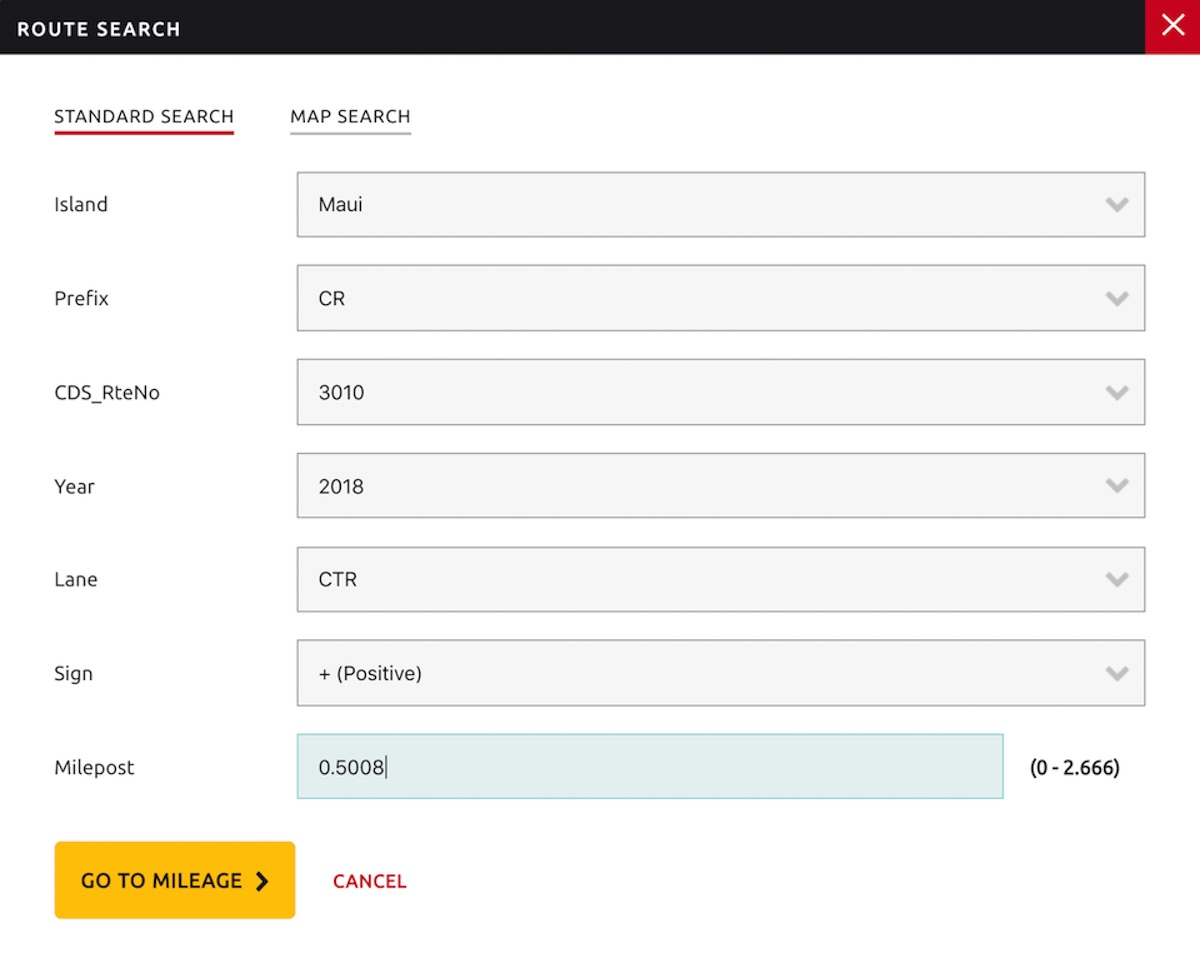
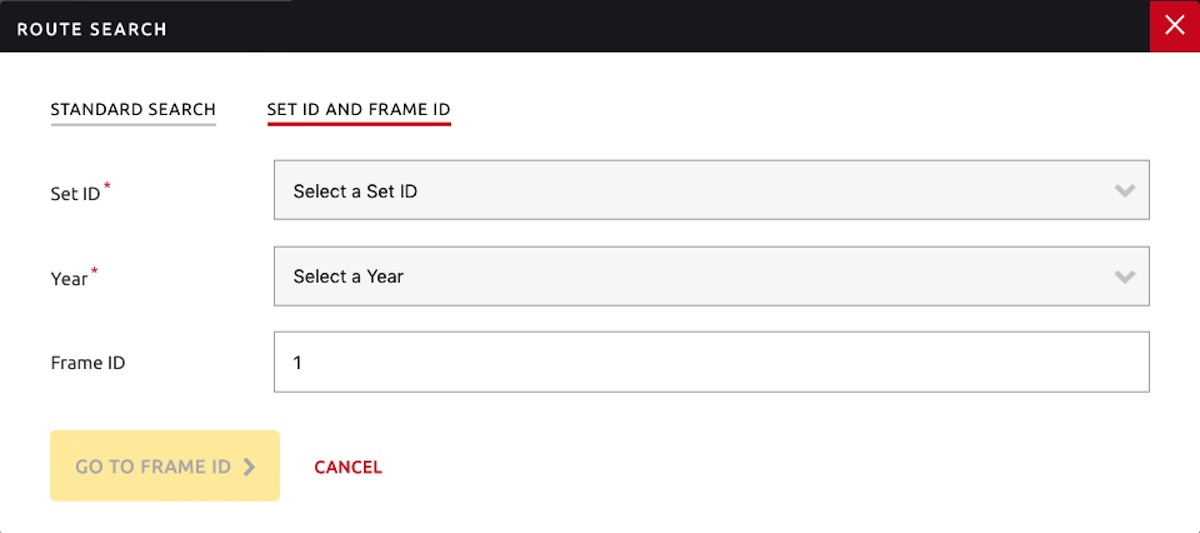
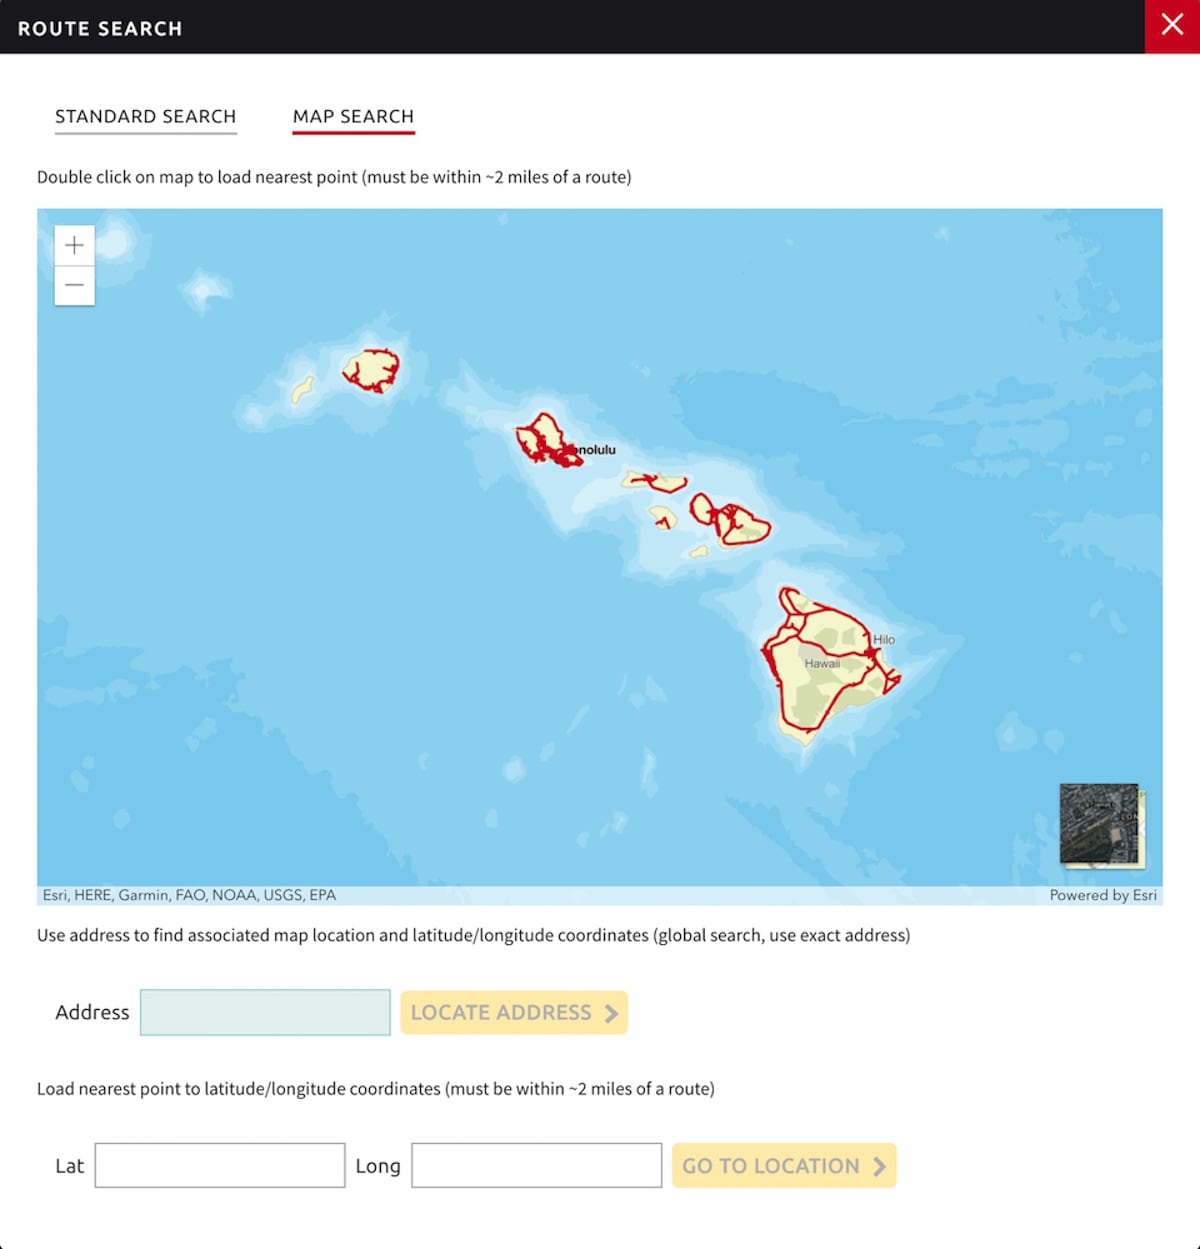
Once you have selected the desired route options, click the Go To Mileage, Go To Frame ID, or Go To Location button. The route then opens at the specified mileage.
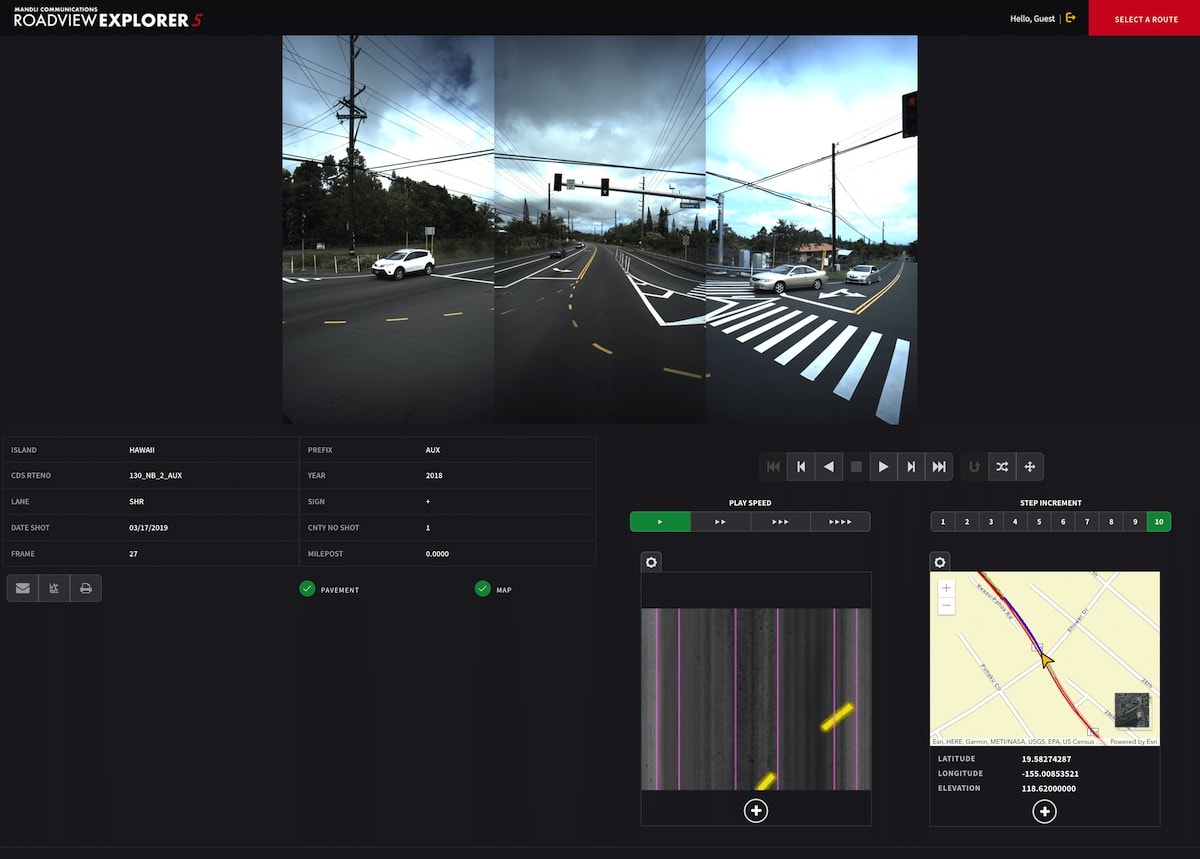
Navigating Through a Route
The control bar is located below the photo area. Hovering the cursor over a button will display its function.
Play Speed Controls

You can change the route's play-through speed by adjusting the Play Speed control. Faster speeds are on the right, and slower speeds are on the left. By default, the route plays at the fastest speed.
You can change the route's frame increment by adjusting the Step Increment control. Higher increments are on the right, and smaller increments are on the left. The step increment is the number of frames moved when playing thorugh the route. For example, if the step increment is 3, every third frame (1, 4, 7, 10, …) is displayed. By default, the route plays at an increment of one (1) frame.
Straight Line Diagram
Depending on availability of data, the Straight Line Diagram can display both directions of a route, all possible lanes of a route, or both directions of all lanes of a route.


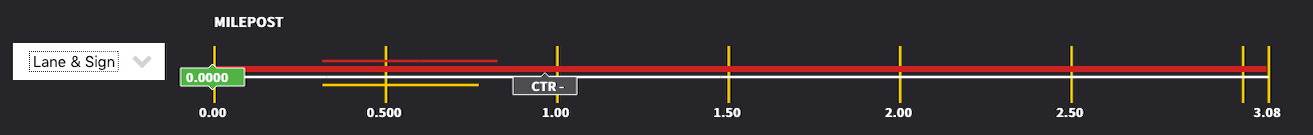
You can change a route's mileage, sign, and direction by double clicking on a line of the diagram. Clicking and dragging the green marker on the current route will adjust the mileage.
Adjusting the Current Route
You can adjust the route position by clicking the Adjust Route button (![]() ). The Adjust Route window opens, where you can change the route position (such as change the mileage position, change the year/cycle, or change the lane). The range of values for the route is also displayed below each field.
). The Adjust Route window opens, where you can change the route position (such as change the mileage position, change the year/cycle, or change the lane). The range of values for the route is also displayed below each field.
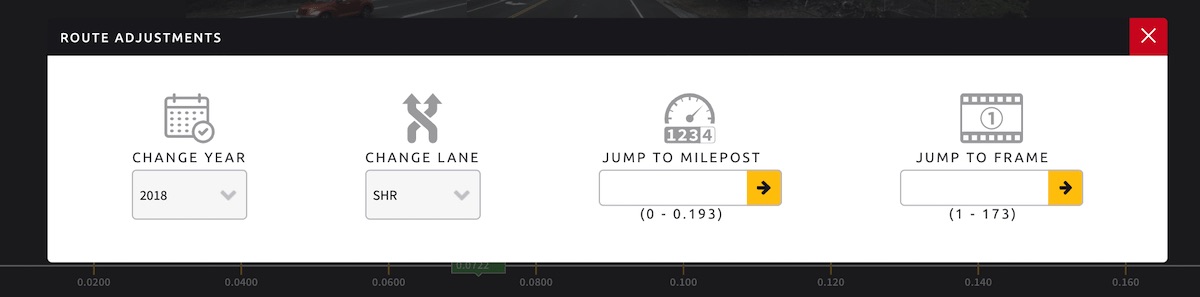
Note that the options in the Route Adjust window may differ based on your system's setup.
Image Zoom Mode
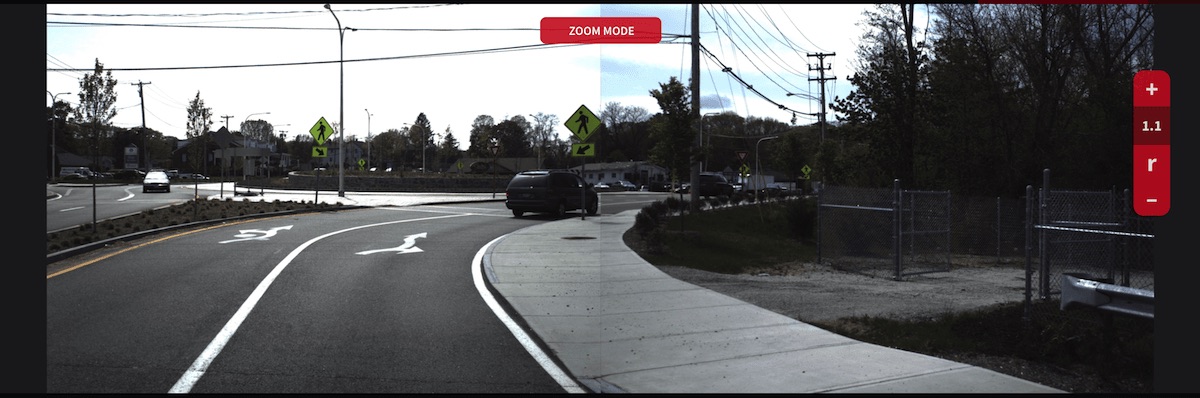
You can zoom in on both the right-of-way and pavement images. To enter zoom mode for right-of-way images, click the Zoom ![]() button in the control panel, or double click in the right-of-way images area.
button in the control panel, or double click in the right-of-way images area.
An indicator appears at the top of the photo area telling you that the zoom mode is activated. The three right-of-way images can be zoomed and panned together. You can zoom with the mouse scroll wheel or by clicking the plus (+) and minus (-) controls on the right-side of the photo area. The current zoom factor is displayed between the plus and minus controls. Clicking the R control resets the image to the initial zoom.
You can exit the zoom mode by clicking the Zoom button again or by double-clicking in the right-of-way image area.
To zoom in on a pavement image (if shown), click the Enlarge (+) button on the bottom of the pavement image. The enlarged image appears in an overlay.
Image Adjustments
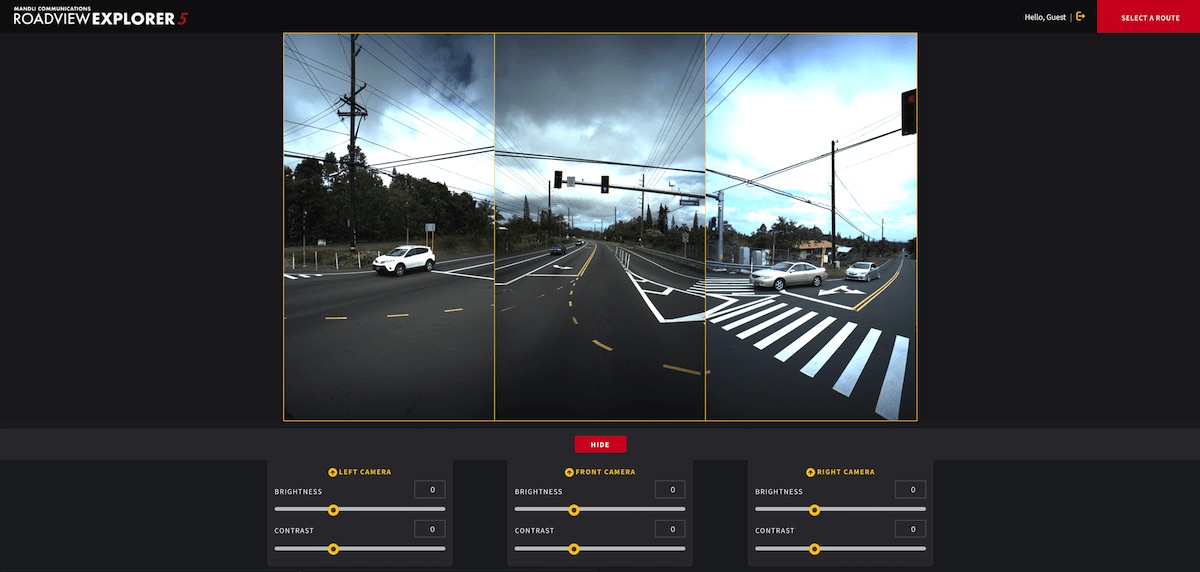
You can adjust the brightness and contrast of images in the photolog by right-clicking in the photolog and selecting the Adjust Images option. The adjustments panel then opens and you can adjust the brightness and contrast of each image. The adjustments will be maintained as you advance through or play through frames.
To remove any image adjustments, right-click in the photolog and select the Remove Adjustments option.
Saving Photolog Images
To save the photolog as a JPEG, right-click in the photolog and select the Save Image option. The image will be saved to your computer.
If there any adjustments to the camera positions to make multiple photolog images appear seamless, those adjustments will not be made in the saved image.
To export multiple photolog and pavement images into a zip folder, click the Export Images to Zip![]() button to open an overlay.
button to open an overlay.
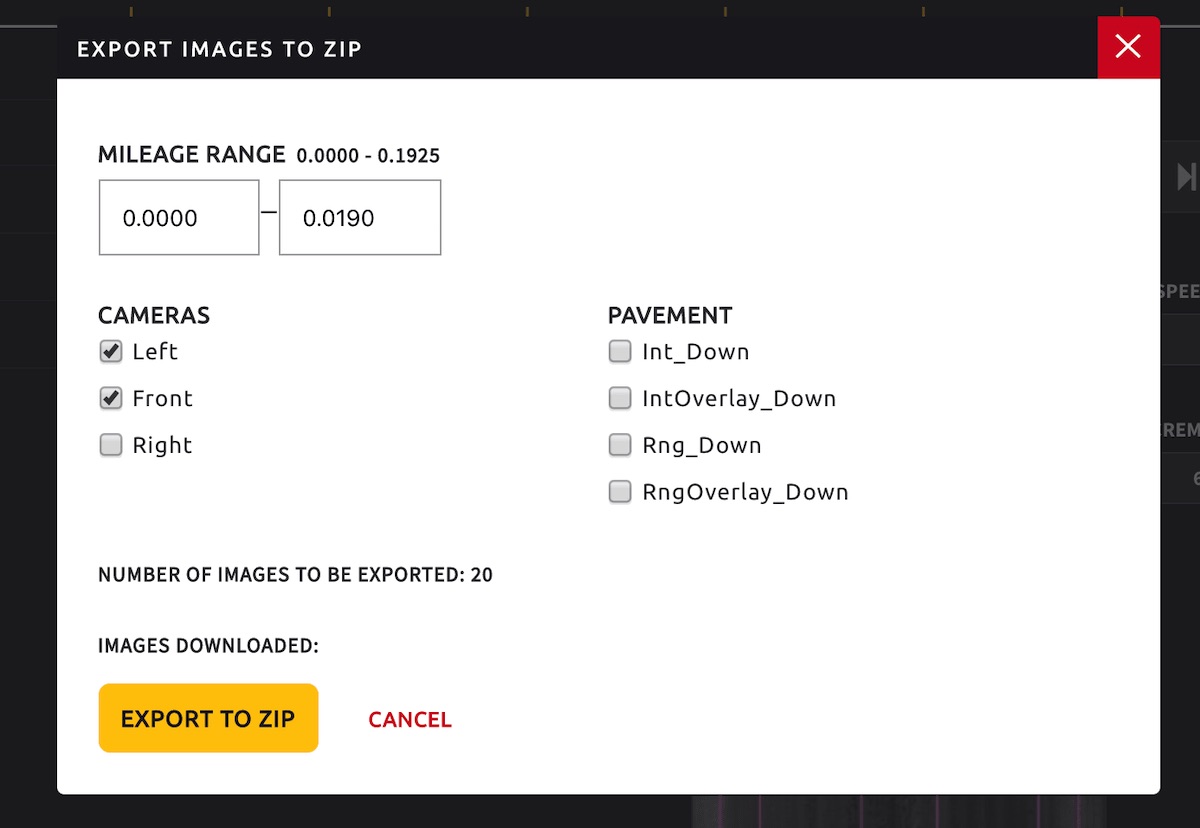
The mileage range is auto-populated with the current mileage plus the next 10 frames. This may be adjusted. Use checkboxes to select the camera and pavement images you would like to download. Exceeding the limit of downloads will disable the download button.
Route Information Panel
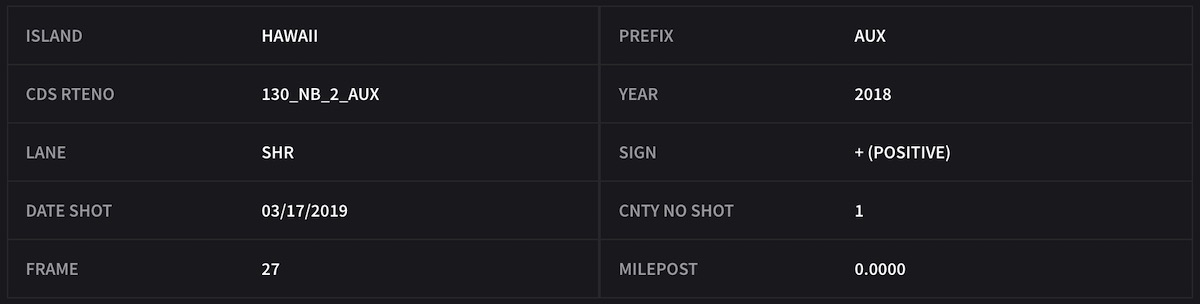
The table displays information relevant to the frame that is being displayed, including:
- UDOT Mileage
- Mandli Mileage
- Route Number
- Interchange
- Ramp Number
- Section
- Direction
- Sign
- Year
- Region
- County Name
- Date Shot
- Description
- Session Name
- Frame
Working with Pavement Images
When pavement images are available, they will appear next to the right-of-way images. To view a larger image of the pavement, click the ![]() icon at the bottom of the pavement image. The Pavement panel then opens.
icon at the bottom of the pavement image. The Pavement panel then opens.
In the Pavement panel, a larger view of the pavement image appears. The image is scaled to fit in the available space.
Frame Control allows for stepping forwards or backwards one frame.
If available, Transverse Profiles may be turned on.
To zoom in on the image, click the measuring icon at the top-right of the Pavement panel. Use the mouse wheel or zoom slider to zoom the image in and out. You can pan (slide) the image by dragging the mouse.
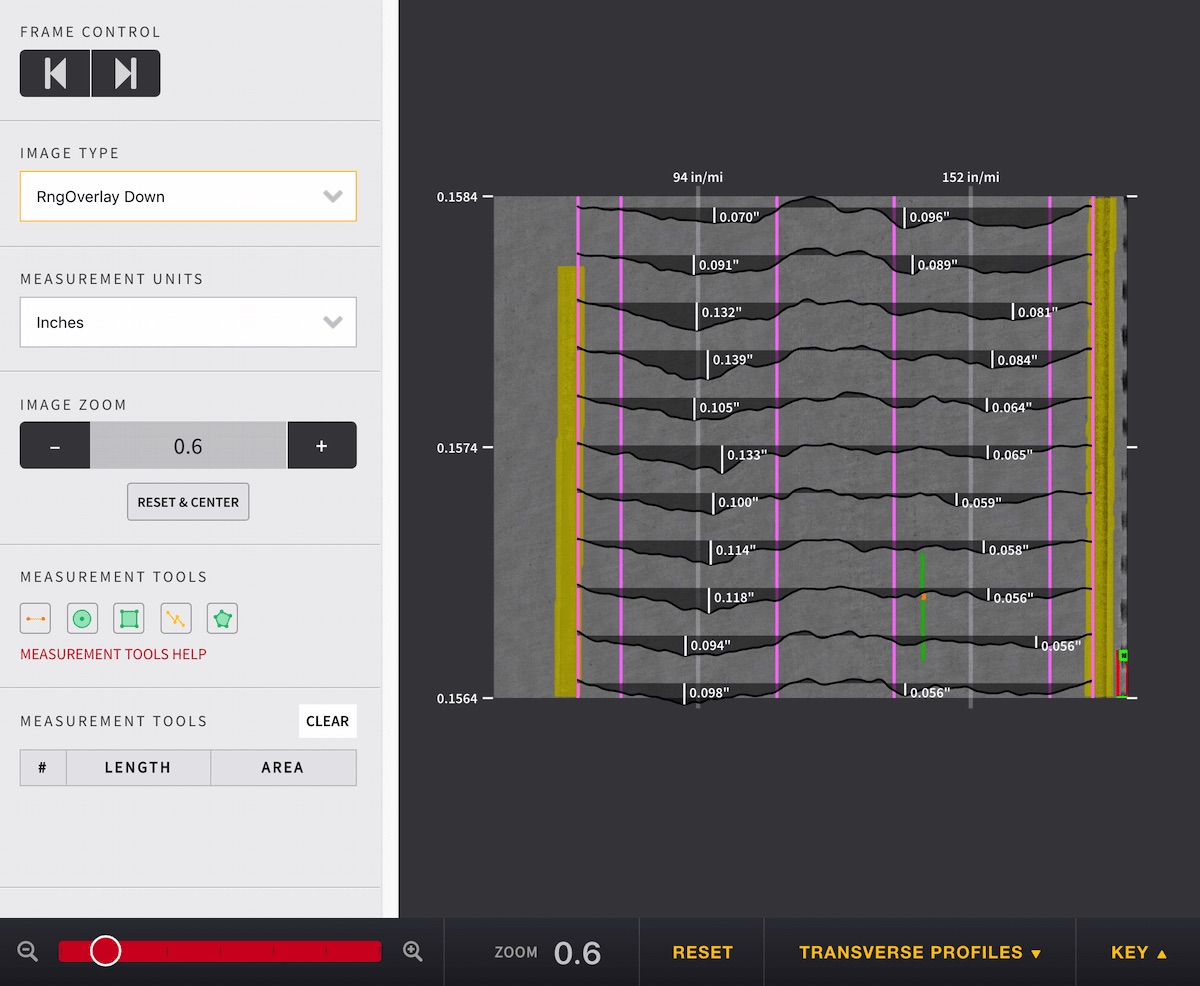
The following drawing tools are available:
- Line: Use the line tool to draw a straight line. Hold down the SHIFT key to draw a horizontal or vertical line. The line's length is added to the Measurements list.
- Circle: Use the circle tool to draw a circle. Click the center point of the circle and then click another point on the outer edge of the circle. The circle's area is added to the Measurements list.
- Rectangle: Use the rectangle tool to draw a rectangle. Click a corner of the rectangle and then click the corner opposite the first corner to draw the rectangle. The rectangle's area is added to the Measurements list.
- Polyline: Use the polyline tool to a series of joined lines. Click the first vertex to start drawing the polyline, and click again for each point you want to add. Double-click to add the last point and complete the polyline. The polyline's length is added to the Measurements list.
- Polygon: Use the polygon tool to a closed shape. Click the first vertex to start drawing the polygon, and click again for each point you want to add. Double-click to add the last point and complete the polygon. The polygon's area is added to the Measurements list.
You can remove all measurements from the image and the table by clicking the Clear button above the Measurements table.
Using the Map to Filter and Sort Assets
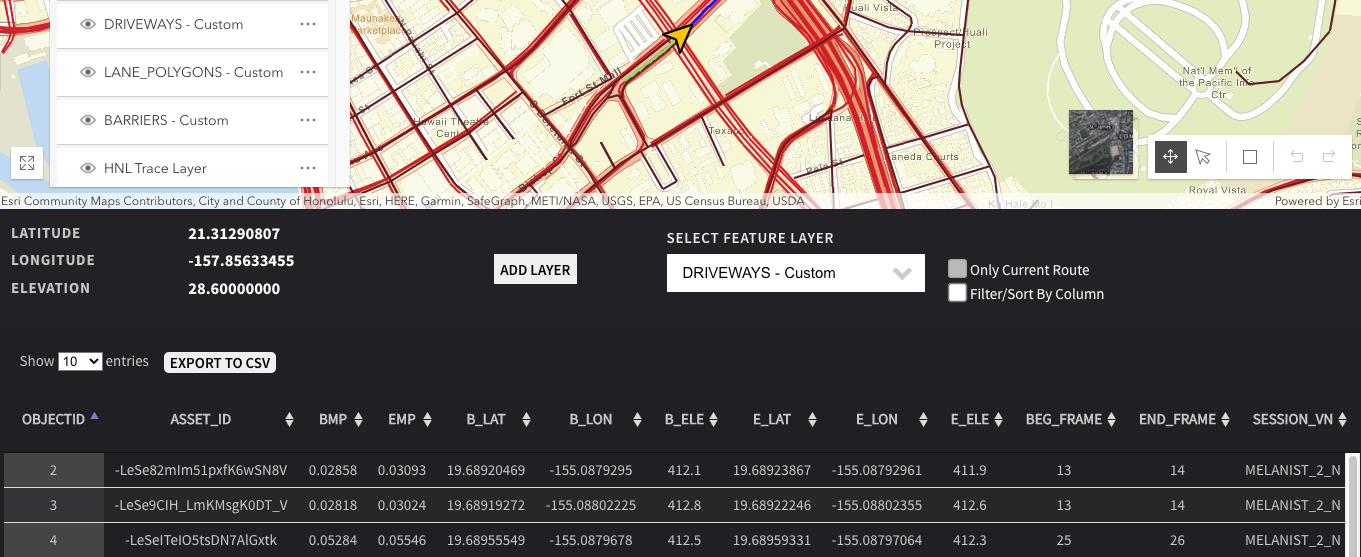
Opening the map in its own window allows you to view, filter, and sort assets. Click the ![]() icon at the bottom of the map to pop out the map. The popped out map has a dropdown of different asset feature layers to select from. Selecting a layer will display the features of the current route on the map with an accompanying table.
icon at the bottom of the map to pop out the map. The popped out map has a dropdown of different asset feature layers to select from. Selecting a layer will display the features of the current route on the map with an accompanying table.
Unchecking 'Only Current Route' will display all of the selected features in the project on the map and table. There is also an option to filter/sort by column.
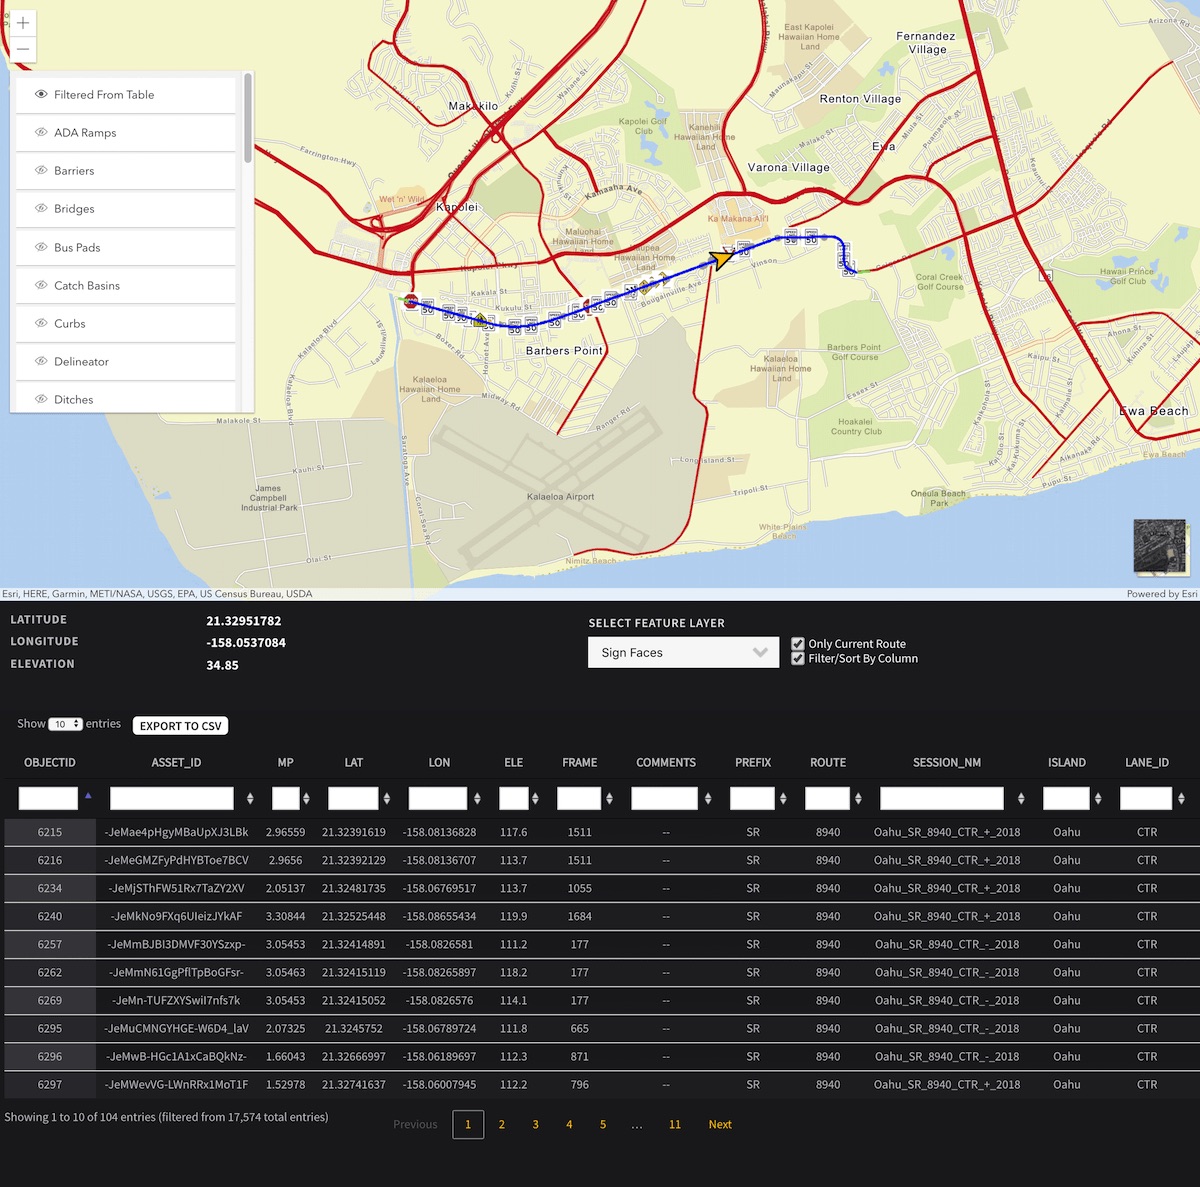
Clicking on a row in the table will move the map to that feature's location. You can then double click on the map near the asset to load the location of that asset in Roadview Exploerer and view it in more detail on the main page.
The table can also be exported to a CSV.
Sketch Widget to Filter Assets
This tool enables you to draw a shape around features on the map as a method of filtering them on the map and table.
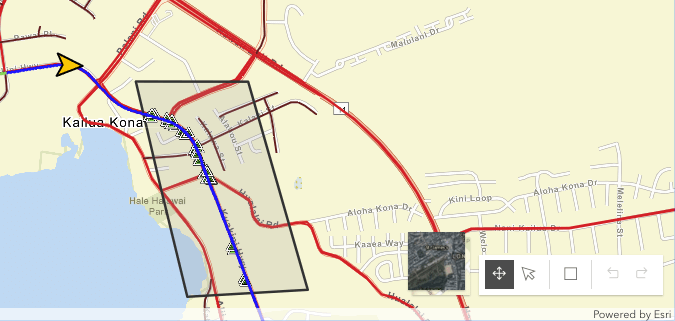
Select the box to the right of the arrow in the bottom right corner of the map to use the Sketch Widget.
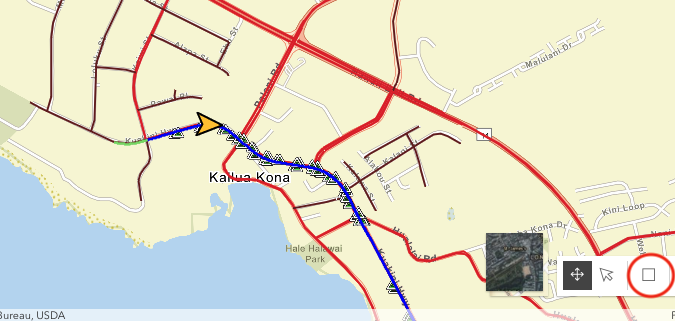
Once the box is selected, the cursor will turn into a crosshair on the map and a shape can be drawn on the map.
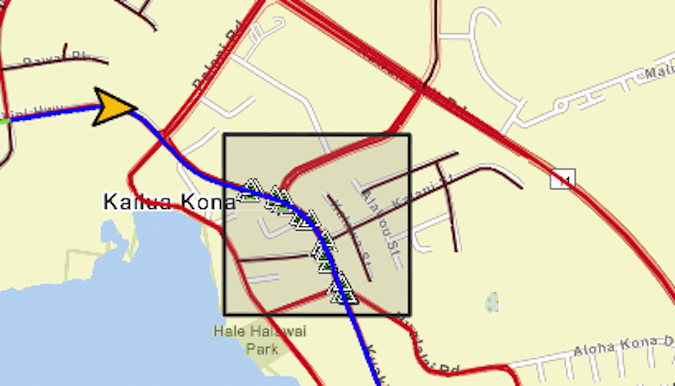
After the shape is drawn, click within the shape to modify the shape's orientation, position, and size.
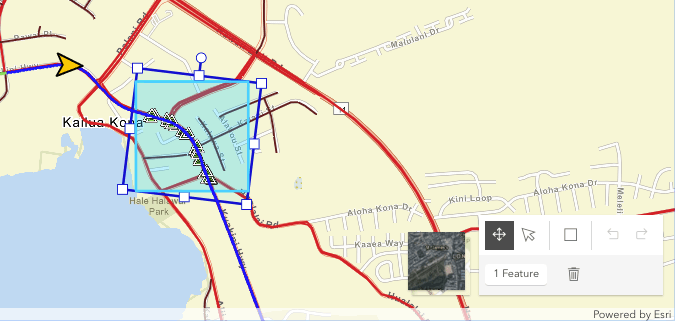
Clicking once more within the shape will enable you to move the shape's verticies.
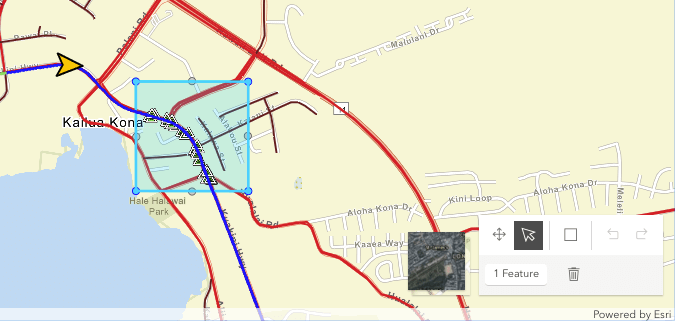
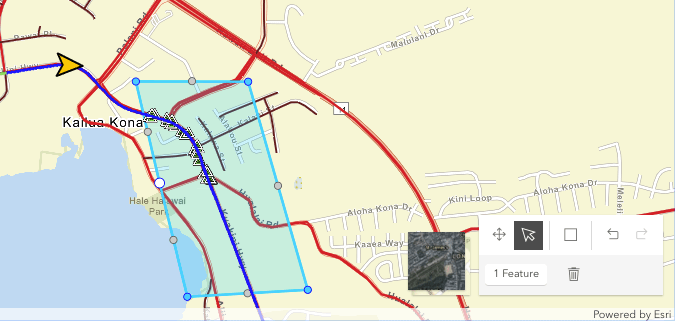
After the desired shape is created, click outside of the shape to see the features within the updated shape.
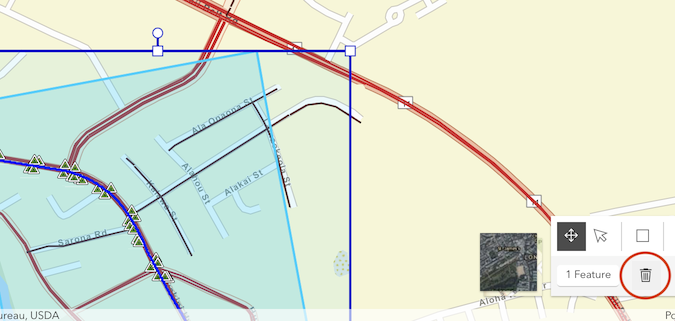
To delete the shape, click within the shape and then click the trash can symbol in the bottom right.
Using the Map to Add Custom Esri Feature Layers
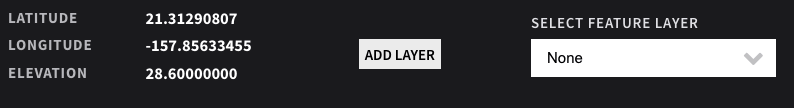
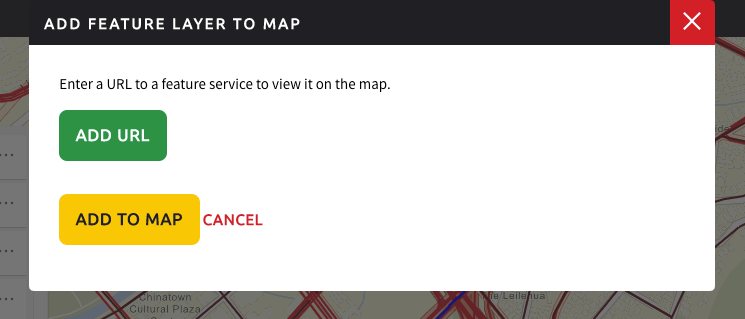
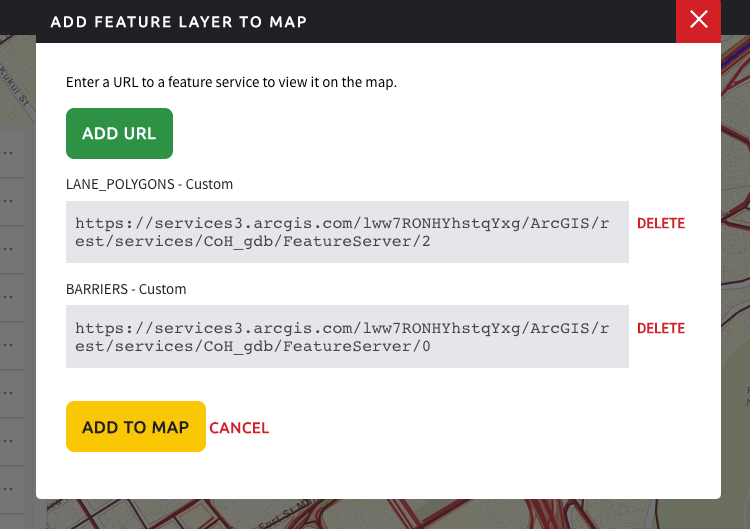
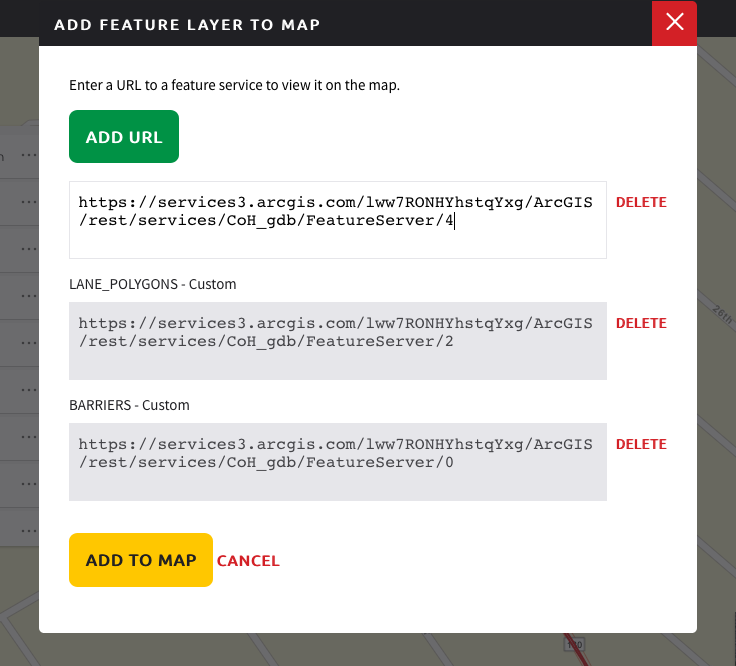
Esri Feature Layers from outside sources can be added to view on the map, table, and Lidar Viewer, when available and within the extent of the current route. To add your own Esri feature layers to the map, click the Add Layer button.
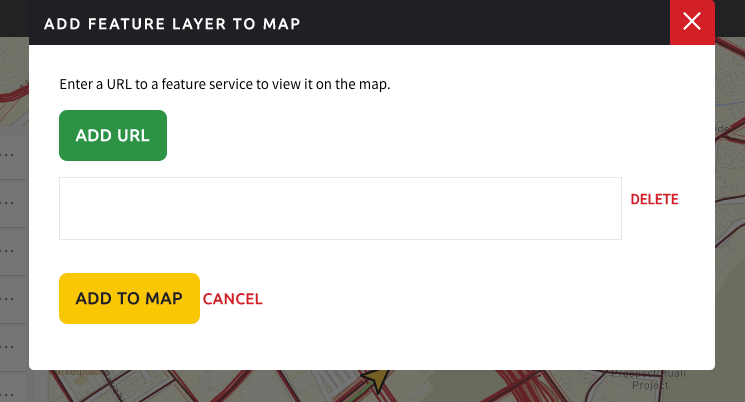
Clicking the button will open an overlay. Clicking Add Url will create a new text box. Enter a valid FeatureServer url into the box. To ensure a url is valid, make sure it is to a feature service end point of a Feature Layer that is publicly accessible.
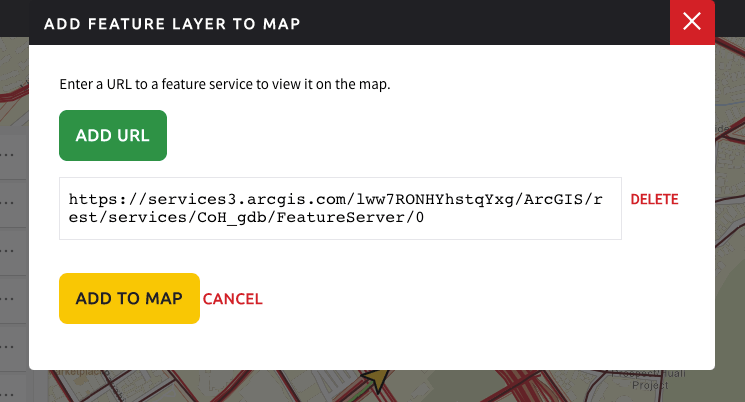
Select Add Url again if you wish to add additional layers. Once the desired urls are added and validated, select Add to Map.
The custom layers will now appear in the layerlist and the Select Feature Layer dropdown. You can select these layers from the Select Feature Layer dropdown to view a layer in an accompanying table.
To view and modify the custom layers on the map, click Add Layer. Layers may be deleted or added.
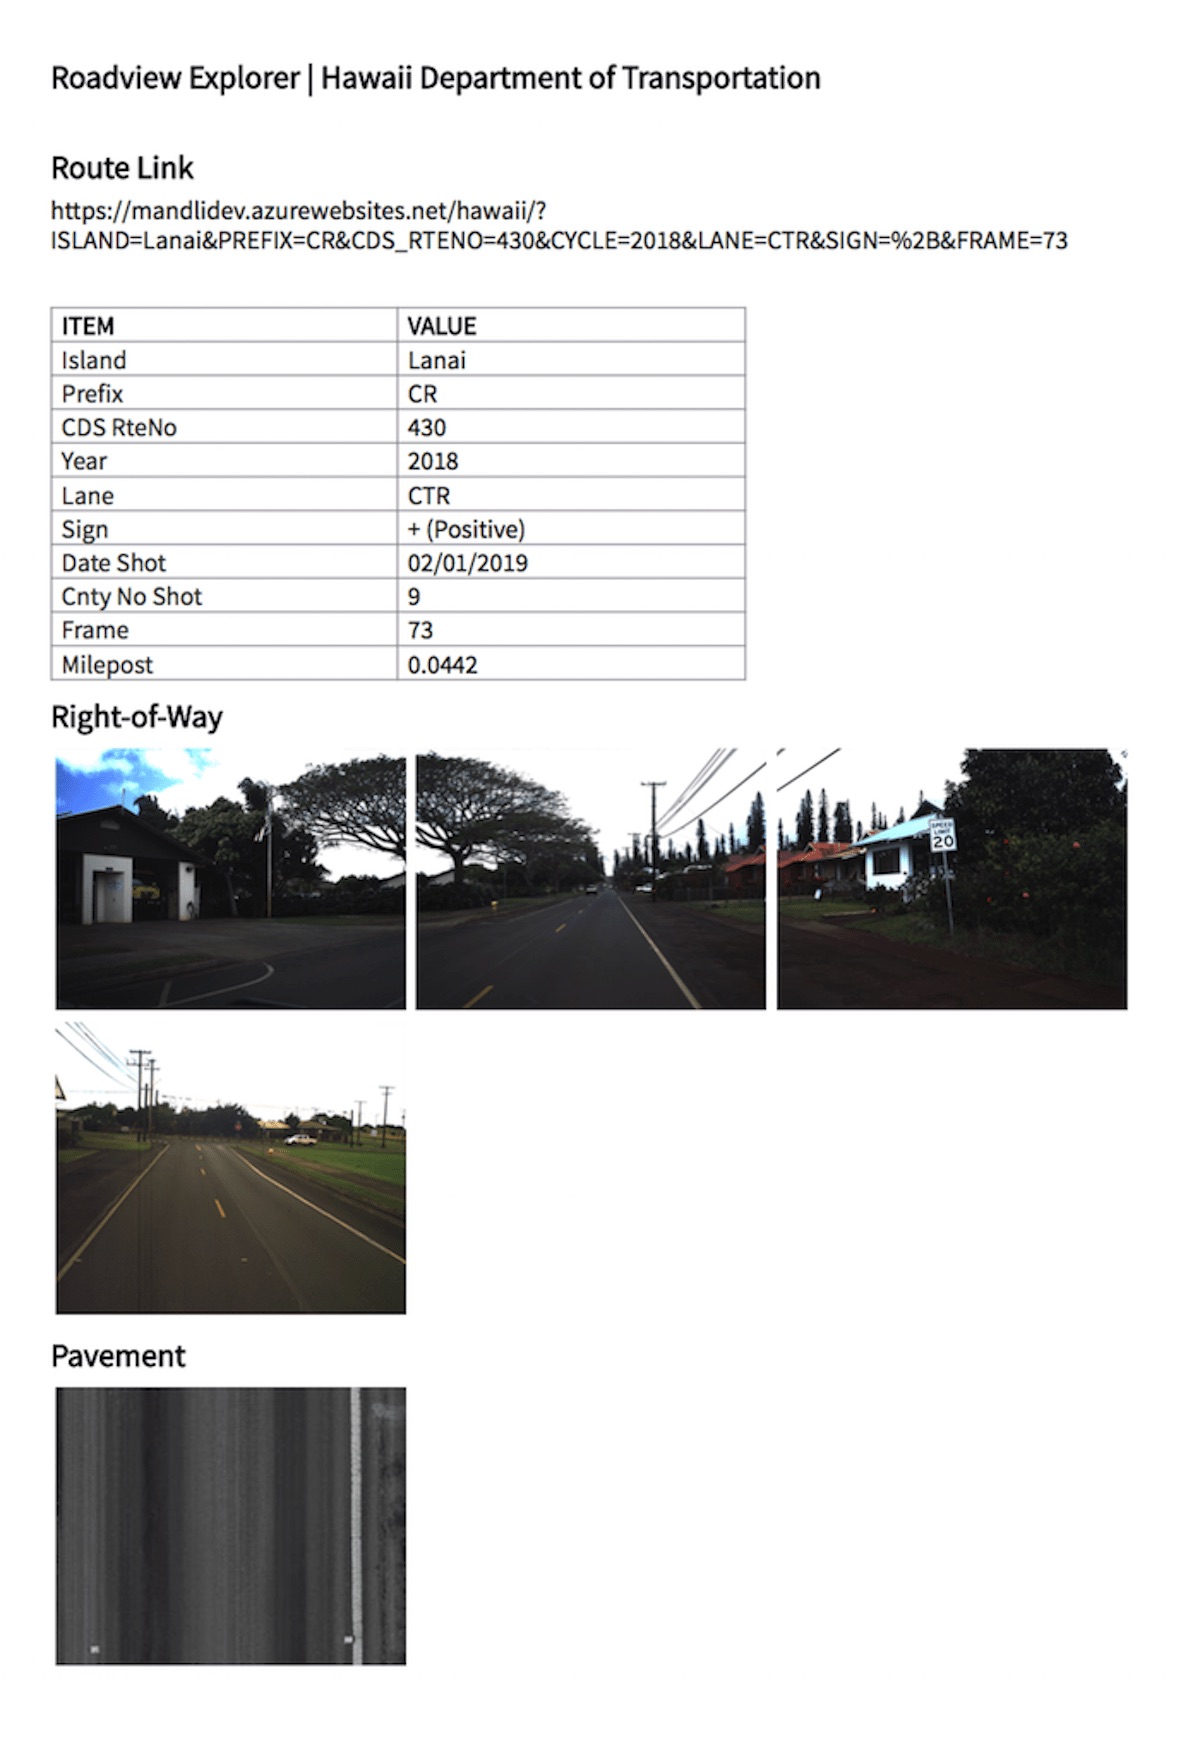
Generating Printable Reports
Click the Print ![]() button to open a printable report containing the current images and route information.
button to open a printable report containing the current images and route information.
Linking Directly to a Frame
You can link directly to a specific frame by including parameters in the URL. The following parameters are available:
- ROUTENR
- SIGN
- CYCLE
- SESSION_NAME
For more information on specific rules, go to the Route Search API Documentation.
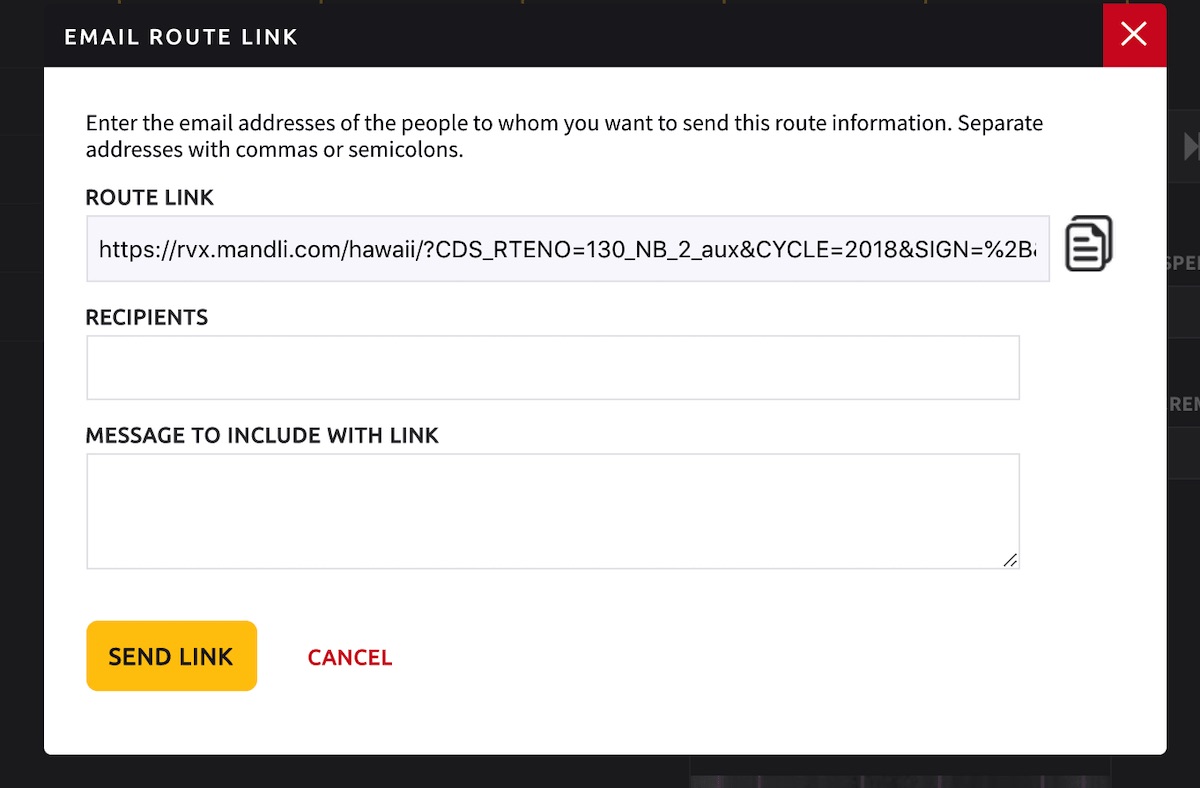
Emailing a Route Position
You can email a link to the current route position to another user. To send a route position message, click the Email icon (![]() ), and complete the information in in the Email Route Link window. After the Route Link field, there is a button to copy the route's link to a clipboard as another method to share.
), and complete the information in in the Email Route Link window. After the Route Link field, there is a button to copy the route's link to a clipboard as another method to share.
Generating IRI Reports
You can generate an IRI table and charts for IRI and Rutting for a given route. You can export the table as a CSV. To make the reports, click the IRI reports button (![]() ) and a window will appear.
) and a window will appear.
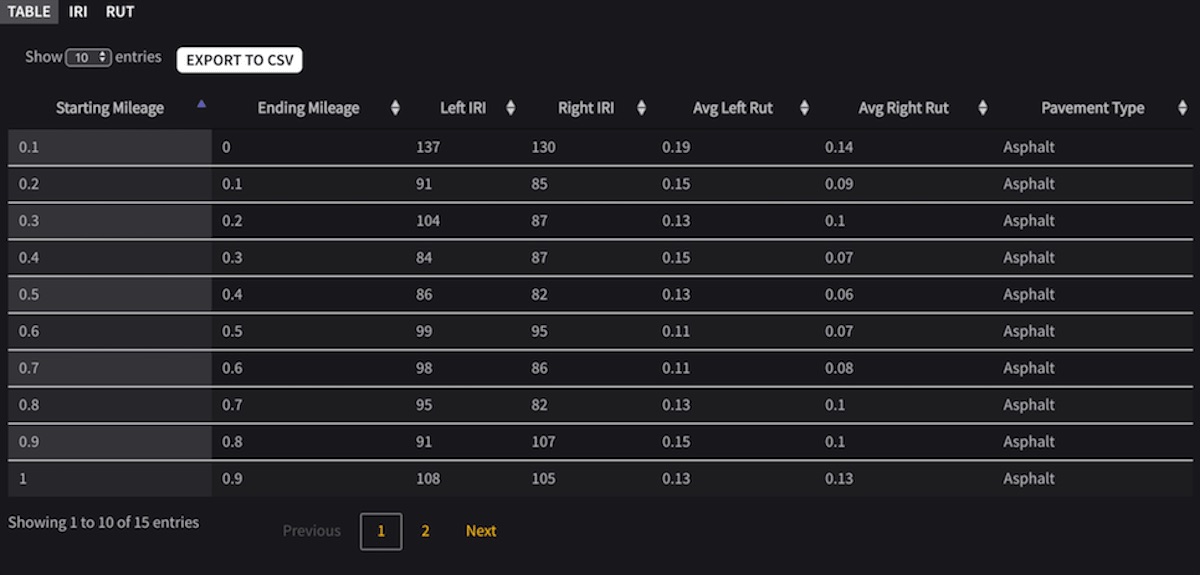
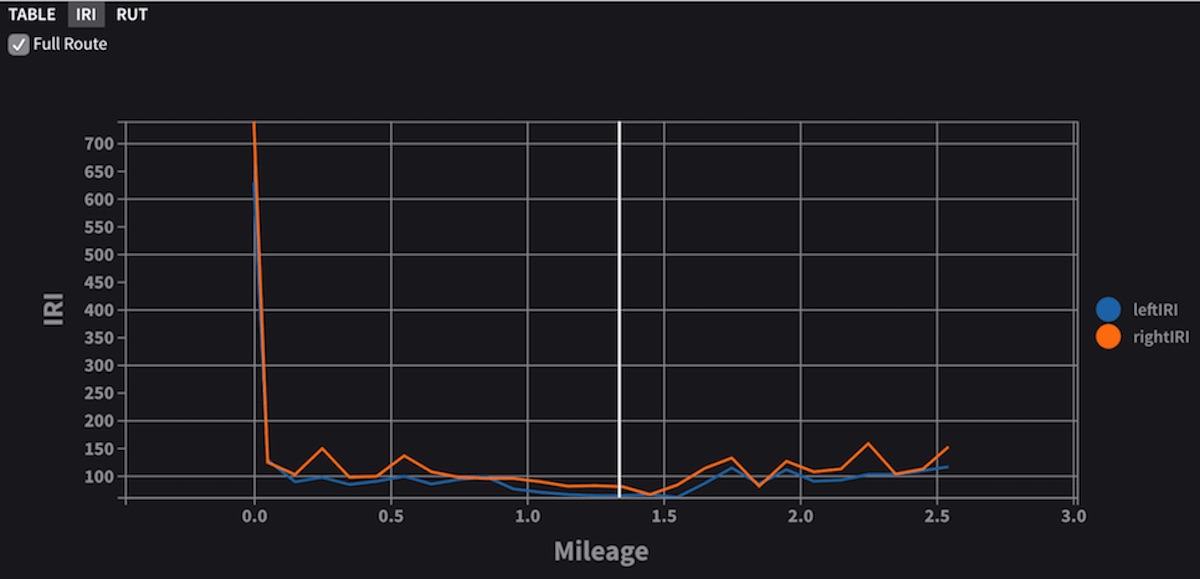
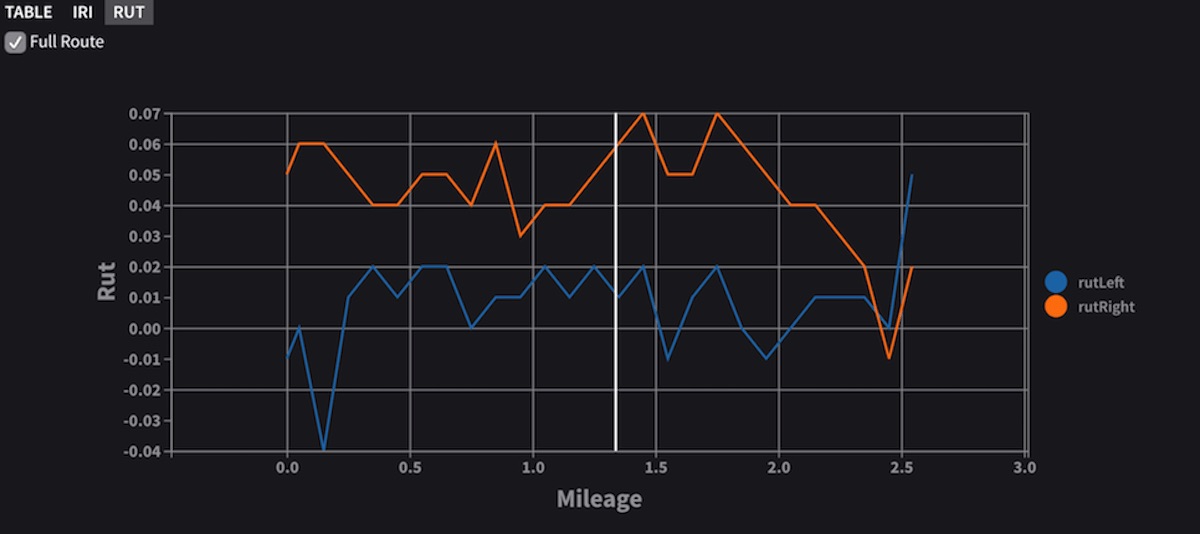
The table and chart will update with playback. The charts may be viewed either as a one mile section or the entire route by toggling Full Route. You can also jump to a specific location of a route by clicking on a row in the table or double clicking on the charts. Additionally, you can sort the table by any field in the table.
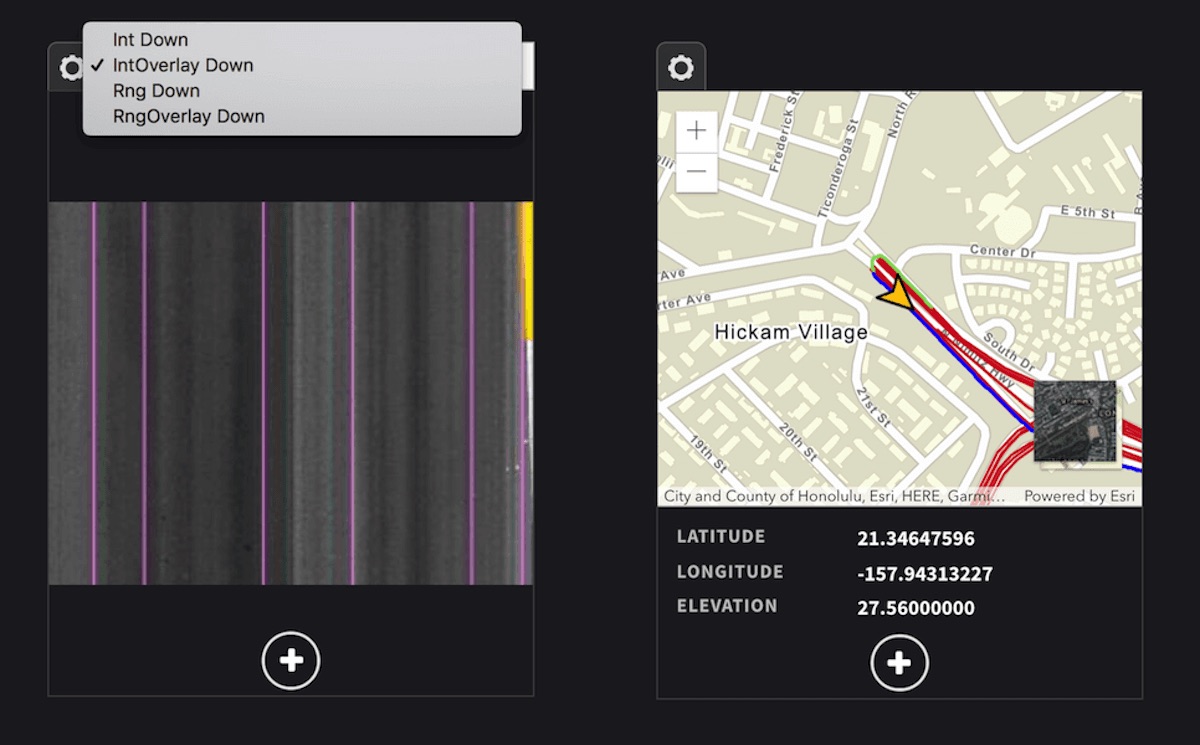
Setting User Preferences
You can set default pavement image and map types for Roadview Explorer. These settings will be saved so that after you close Roadview Explorer, the next time you re-open or refresh the app, the settings will be in effect.
To set your preferences, click the settings icon (![]() ) just above the embedded pavement image and embedded and popped out map. Dropdowns will appear where you can make your selection.
) just above the embedded pavement image and embedded and popped out map. Dropdowns will appear where you can make your selection.
Release Notes
March 17, 2023
Liar playback
Lidar playback starts with a jump to the current frame location
Image export
User sees a byte counter and warning message during image export when the size of the archive exceeds 2GB
KML files
A custom KML file can be added to the Map. The file should be hosted on a remote server
Sign picker
Sign picker shows description of the selected field
Feature Llyer editing
A user can add, edit, and save multipoint features such as lines and polygons (assets) with Lidar Viewer
Hotkeys
A user can add or remove a feature vertice with the hotkeys + / -
New measurement unit
The INCH measurement unit is set as a default one
Assets selection
A threshold is set to group fewer assets that are close to each other. A user can move to the next feature with a shortcut or tooltip arrow
Pavement image
A user can toggle visibility of a pavement image right next to the photoblog camera images
Camera toggle
A user can toggle visibility of each camera for certain photoblog camera types
November 1, 2022
U-Turn button
The U-Turn button is set to return current cycle
Horizontal scroll
A horizontal scroll is available to fit more data columns in the Map table
Training modules
A Training Modules section is added to the help page
Playback synchronization
LiDAR position and photolog images are synchronized for better playback experience
Usage CSV export
The CSV usage export file contains a user group column
New measurement unit
The INCH measurement unit is added
Assets grouping
A threshold is set to group fewer assets that are close to each other
Hotkeys
Hotkeys for the synchronized playback and asset size are added.
September 15, 2022
Map extent
The map extent for the loaded assets is increased to include more space from both sides
OAuth 2
OAuth 2 is implemented for ESRI feature layers. A user can add both public and private layers hosted on ArcGIS online
Distance measuring tool offset
A user can offset measuring distance nodes up or down by 6-inch increments
Feature layer editing
A user can Add/Edit/Remove features on the Map with the ESRI feature layer Editor Widget
Pavement table column
Columns of the pavement table may be reordered
June 30, 2022
Negative fault vlues are shown
The pavement window shows the fault readings that are less than 0.000
Lines and polygons dispaly
Ocasional tears and spikes of the LiDAR asset shapes are eliminated
LiDAR export by mileage range
A user can export a LiDAR point cloud trimmed by a mileage range. When the export is completed the user receives a link to the LAZ file via email
April 14, 2021
Downloading LCMS disteress .xml files
A user can download LCMS distress files separately
Add new assets
A user can add a new point shape asset in an editable feature layer
Layer classification message
Message is shown if a feature layer has classification
Asset point size slider
A user can adjust the size of an asset point
Extent checkbox
A user can select visual extent to display feature layer assets